Risk-based inspection example: how a vessel gets its next inspection date
·Updated ·8 sources
This risk-based inspection (RBI) example sets the next inspection date for a made-up vessel from its corrosion rate, uncertainty and consequence. It follows six steps, rates risk on a simple matrix designed for this page, and places the inspection before risk passes a target. All numbers are illustrative, not from API RP 581.
By Jun Zhong, Editor·Researched and drafted by Beacon's AI newsroom·Checked by Jun Zhong, Editor·Last checked ·Next review
Why does it matter?
Your last survey took six spot thickness readings on a vessel that can thin locally. Is the next inspection due now, or in two years? API describes an inspection as reducing uncertainty about the damage present, not the risk itself 1. The less an inspection could see, the more doubt is left, and a sound plan allows for that doubt. The worked example below shows how the answer depends on how much the last inspection could actually see.
What are the steps?
- Gather the data: design records, materials, inspection history and actual operating conditions. After the 2010 Anacortes rupture, the US Chemical Safety and Hazard Investigation Board (CSB) found that reviews had relied on design conditions instead of actual ones 3.
- Name the damage mechanisms and where they act. In that same case, the mechanism that caused the rupture had not been identified as credible 3.
- Estimate the damage rate and how sure you are of it. OSHA has cited refineries for not calculating corrosion rates to decide how often to measure thickness 4.
- Rate likelihood and consequence and read the risk. A 2026 open-access paper notes that a risk matrix is often used, with impact on one axis and likelihood on the other 7.
- Compare risk with the target and set the date so the inspection happens before the target would be reached 1.
- Inspect, update and repeat. EPA's inspector guidance notes that a risk-based assessment can lengthen or shorten an inspection interval 2.
How does the worked example run?
Illustrative numbers, not from any real asset or standard table
The uncertainty allowances, likelihood bands and matrix below were made up for teaching. They are not the API RP 581 method.
Step 1: data.
| Input | Value (illustrative) |
|---|---|
| Item | V-101, a fictional horizontal carbon steel drum holding flammable liquid, near an occupied building |
| Baseline wall thickness, 2010 | 16.0 mm (0.63 in) |
| Minimum required thickness | 10.0 mm (0.39 in), an input from the design code calculation; this page does not calculate it |
| 2017 survey, six fixed spot readings | lowest 14.5 mm |
| 2024 survey, same six points | lowest 13.0 mm |
| Risk target (owner's rule) | No item may sit in a "High" cell |
Step 2: damage mechanism. Internal thinning, which can be general or concentrated at the bottom of the drum. One mechanism is used here for simplicity.
Step 3: rate and confidence (2024).
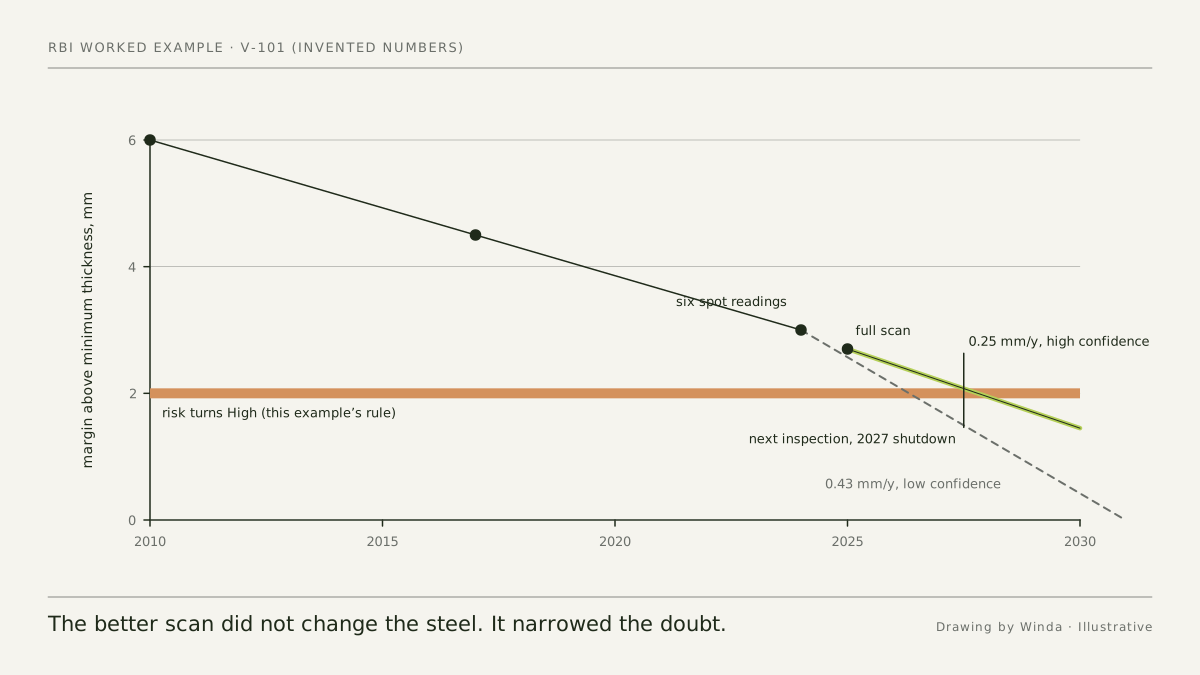
- Long-term rate: (16.0 − 13.0) mm ÷ 14 years = 0.21 mm per year (mm/y). Short-term rate, 2017 to 2024: 1.5 mm ÷ 7 years = 0.21 mm/y.
- Margin above minimum: 13.0 − 10.0 = 3.0 mm.
- Six spot readings cannot rule out a thinner patch elsewhere, so this example doubles the rate for low-confidence data: 0.43 mm/y.
- Projected remaining life: 3.0 ÷ 0.43 = 7.0 years. Without the allowance it would be 14.3 years.
Step 4: likelihood, consequence and risk. This page's likelihood bands use projected remaining life: Remote (12 years or more), Unlikely (8 to under 12), Possible (4 to under 8), Likely (under 4). The flammable liquid near an occupied building is rated Serious.
| Likelihood (rows) by consequence (columns) | Minor | Moderate | Serious | Major |
|---|---|---|---|---|
| Likely | Medium | High | High | High |
| Possible | Low | Medium | High | High |
| Unlikely | Low | Low | Medium | High |
| Remote | Low | Low | Low | Medium |
With 7.0 years, likelihood is Possible; Possible and Serious gives High, above the target. Result for 2024: inspect at the next shutdown, in 2025, with a method that covers the bottom of the drum.
Step 5: inspect and update (2025). An automated ultrasonic scan of the lower shell and heads finds a local low of 12.7 mm, thinner than any of the six fixed points showed.
- Local rate: (16.0 − 12.7) mm ÷ 15 years = 0.22 mm/y. With high coverage the example adds only 15%: 0.22 × 1.15 = 0.253, rounded to 0.25 mm/y.
- Margin: 12.7 − 10.0 = 2.7 mm. Remaining life: 2.7 ÷ 0.25 = 10.8 years, so Unlikely; Unlikely and Serious gives Medium, within the target.
- Risk turns High when remaining life falls below 8 years, that is when the margin falls to 8 × 0.25 = 2.0 mm. Losing 0.7 mm at 0.25 mm/y takes 2.8 years.
Step 6: next date. About 2.8 years after the 2025 scan, so the next inspection is planned for a 2027 shutdown. Any maximum interval set by the applicable inspection code, or any frequency required by law, still applies, and the earlier date governs 5,6.
| Case (illustrative) | Rate used (mm/y) | Margin (mm) | Remaining life (years) | Likelihood | Risk | Next inspection |
|---|---|---|---|---|---|---|
| 2024, six spot readings, low confidence | 0.43 | 3.0 | 7.0 | Possible | High | Next shutdown, 2025 |
| 2025, full scan, high confidence | 0.25 | 2.7 | 10.8 | Unlikely | Medium | 2027 shutdown |
| 2024 measured rate, no allowance (not used) | 0.21 | 3.0 | 14.3 | Remote | Low | Would ignore uncertainty |
How should the result be read?
The scan did not slow the corrosion; it found a thinner spot and still moved the date out, because it removed most of the doubt about where the worst metal loss is. That is the point API makes when it says inspection reduces uncertainty and not risk 1. In real plants, fixed points have missed the fastest-thinning component: at a Philadelphia, Pennsylvania, refinery in 2019, no monitoring point sat on the elbow that failed 8.
What are the limits of this example?
- It is not API RP 581. A 2026 open-access paper describes the API approach as a generic failure frequency combined with a factor for damage mechanisms, with a separate consequence analysis 7. None of that is used here.
- The allowances, bands and matrix are invented. Owners set their own targets; CSB notes that US process safety rules do not require risk to be reduced to a specific target 3.
- One mechanism only. A real study has to cover every credible mechanism, using actual operating conditions 3.
- Two readings make a weak trend. OSHA reminds employers that over a pipe's life its thickness must be measured at predetermined locations 4; more surveys at those points give a better trend.
- Odd readings need follow-up. OSHA's refinery review says anomalous results, such as thickness that appears to increase, must be retested and resolved 4.
Where integrity problems show up
| Decision | Data it depends on | What goes wrong without it | In the Library |
|---|---|---|---|
| Where to take readings | The damage mechanism, general or local, and where it concentrates | OSHA cited refineries for not testing pressure vessels with ultrasonic thickness methods and for not inspecting a boiler at the locations named in the employer's own chosen engineering practice 4 | What are condition monitoring locations (CMLs)? |
| Which corrosion rate to use | Several readings over time at the same points | OSHA found measured corrosion rates above expected rates left unaddressed 4 | Corrosion rate and remaining life calculator |
| How large an uncertainty allowance to apply | Method, coverage and how representative the readings are | Philadelphia, 2019: no monitoring point sat on the elbow that failed, so the measured rate did not describe it 8 | Inspection effectiveness |
| Fixing the final date | Code or legal maximum intervals | US process safety rules tie frequency to good engineering practice and to experience 5; in Great Britain the written scheme of examination, drawn up or certified by a competent person, sets frequency 6 | How are inspection intervals set for vessels, piping and tanks? |
Sources: OSHA 3918, 2017 4; CSB report 2019-04-I-PA 8; 29 CFR 1910.119(j)(4) 5; PSSR 2000, regulation 8 6.
Common questions
- Why not just use the measured corrosion rate?
- Because the readings may not include the worst spot. In this example the full scan found metal thinner than any fixed point showed. The allowance stands for that doubt.
- Where does the minimum required thickness come from?
- From the design or in-service code calculation for the item; it is an input here, not calculated. See [Minimum required thickness](/glossary/minimum-required-thickness/).
- Is this how API 581 calculates risk?
- No. This is a teaching example with invented numbers and a matrix made for this page. For what API RP 581 is and what it covers, see [What is API 581?](/library/api-581/).
- Can a better inspection lower the risk?
- It cannot remove damage. It narrows the uncertainty about the damage, which can move the risk estimate in either direction.
Beacon explains these concepts in its own words for education. It does not reproduce or replace the standards cited, and Winda is not affiliated with or endorsed by the organizations that publish them. Engineering decisions need the current edition of the standard and a qualified engineer.
Sources
- 1.2025 Publications Catalog (entries for API RP 580 and API RP 581) · American Petroleum Institute (API)
- 2.SPCC Guidance for Regional Inspectors, Chapter 7: Inspection, Evaluation, and Testing · US Environmental Protection Agency (EPA) ·
- 3.Investigation Report: Catastrophic Rupture of Heat Exchanger (Seven Fatalities), Tesoro Anacortes Refinery, Anacortes, Washington, April 2, 2010, Report 2010-08-I-WA · US Chemical Safety and Hazard Investigation Board (CSB)
- 4.Process Safety Management for Petroleum Refineries: Lessons Learned from the Petroleum Refinery Process Safety Management National Emphasis Program (OSHA 3918-08 2017) · US Occupational Safety and Health Administration (OSHA)
- 5.29 CFR 1910.119, Process safety management of highly hazardous chemicals · eCFR, US Office of the Federal Register
- 6.The Pressure Systems Safety Regulations 2000 (SI 2000/128), regulation 8 · legislation.gov.uk, The National Archives
- 7.Toward the application of the Risk-Based Maintenance approach to a hydrogen-fueled manufacturing plant (G. Collina and others), International Journal of Hydrogen Energy 238, 155318, open access under CC BY 4.0 · Elsevier, via OSTI.gov (co-authored by the US National Laboratory of the Rockies)
- 8.Investigation Report: Fire and Explosions at Philadelphia Energy Solutions Refinery Hydrofluoric Acid Alkylation Unit, Report 2019-04-I-PA · US Chemical Safety and Hazard Investigation Board (CSB)